| Go back to Sun Hill Observatory |
SHON - Article
Orbital Period and Light Curve Changes in the Eclipsing Binary V839 Ophiuchi
Petr Molik
Petrin Hill Observatory, Strahovska 205, 118 46 Prague 1, Czech Republic
Abstract
V839 Ophiuchi is a relatively well-studied eclipsing binary of the W UMa-type. Visual observations of this star (2076 estimates of brightness) made by the author of this paper at the Petrin Hill Observatory (Prague) in the years 1994-1995 yielded 75 times of minimum light. The analysis of all available (284) times of minima from the interval 1945-1996 confirmed the general trend toward orbital period increase first reported by Hajek (1991). The increase has not been continual but three abrupt period changes can be distinguished: first within the interval 1945-1958, second in 1978, and third in 1989. The large amount of visual observations enabled to investigate also short-term period variations. It was found that in 1994 the period had shortened at least by 4.4 second (which is the largest period change ever observed in a W UMa star) and in 1995 the period had increased by 2.9 second.
The author's observations revealed also extremely high and rapid variability of the light curve. In contrast to usual light curves of W UMa-stars there were distinguishable beginnings and ends of eclipses. The duration of eclipses (D) varied between 1 to 2.3 hours, some minima were sharp some other had intervals of constant light (d) lasting up to 45 minutes, large asymmetries and phase shifts of the light curve caused quasi-periodic displacements of times of minima with amplitude up to half an hour, etc. After brief discussing all conceivable explanations the author proposes a hypothesis that V839 Oph is a semi-detached system with an accretion disk around its primary component. Partial loss of the disk and strong eccentricity of its residue had caused the unprecedented decrease of orbital period and extreme variability of the light curve. The comparison of V839 Oph with other W UMa-stars suggests that it is not a unique object. Its semi-detached configuration with accretion disk is applicable also to other "active" W UMa's, e.g. to VW Cep, AW UMa, 44 i Boo, and TZ Boo.
1. Introduction
The variability of V839 Oph (BD 9° 3584, HD 166231, GSC 1009.0264, R.A.(2000) 18h 09m 21s, Decl.(2000) 9° 09' 04'', Max=8.8 mag V, Min=9.4 mag V) was discovered photographically by French astronomer R. Rigollet in the year 1945. On the basis of 131 visual estimates of brightness obtained from May 12th to July 12th, 1945, he determined the period of variability, constructed a mean light curve, and calculated preliminary light elements. From the shape of the mean light curve he deduced that the variable is an eclipsing binary of the W UMa type and that the period value of 5 hours determined by him is in fact double (Rigollet, 1947).
First photoelectric photometry of V839 Oph was done by L. Binnendijk at the Flower and Cook Observatory (Philadelphia, USA) in the years 1958-1959. This author confirmed the variability of W UMa type and determined three times of minimum light. From two primary minima timings spanning one year he calculated more precise light elements (Binnendijk, 1960).
Further photoelectric observations of V839 Oph were published by Wilson and O'Toole (1965), Lafta and Grainger (1985) and Niarchos (1989). Photoelectrically observed times of minimum light (but without individual photometric data) were presented by Popovici (1966, 1970), Hanzl (1990, 1991, 1994), Demircan et al. (1994), Agerer and Hübscher (1995), Wolf et al. (1996), and Akalin and Derman (1997). Since the 60's this eclipsing binary has been observed visually by amateur astronomers in the Czech Republic, Switzerland, Germany, United Kingdom, and occasionally in other countries.
V839 Oph was one of 12 stars of the W UMa type that were observed on radio frequencies by VLA at the National Radio Astronomy Observatory, New Mexico, USA (Hughes and McLean, 1984). It was included among 17 contact binaries surveyed by the X-ray satellite HEAO 2 known also as the Einstein Observatory (Cruddace and Dupree, 1984). Due to relative proximity (about 100 parsecs), the star was included into the HIPPARCOS satellite program of parallax measurement of eclipsing binaries (Dworak and Oblak, 1987,1989). No spectroscopic observations of V839 Oph have been published so far except three spectrograms obtained at the Dominion Astrophysical Observatory (Canada) in 1972 that were used for spectral class determination only (Hill et al., 1975).
According to the Catalogue of eclipsing and spectroscopic binary stars in the regions of open clusters (Popova and Kraicheva, 1984) V839 Oph lies within the region of Mel 186 but there is no evidence that it is a member of this cluster.
2. Method of observation and data reduction
The author of this paper observed V839 Oph visually with the use of 20cm (8 in.) refractor at the Petrin Hill Observatory in Prague (Czech Republic). Focal length of this instrument is 137cm (4,5 ft), magnification 55 times. The star was observed on 44 nights in 1994 (total 789 estimates of brightness) and on 42 nights in 1995 (total 1287 estimates of brightness).
Visual estimates were done by the method of Nijland-Blazhko using a series of three comparison stars (GSC 1009.1940, GSC 1009.0464 and GSC 1009.0067). In the year 1995 another comparison star (GSC 1009.0237) was added between the second and third star of the series. The photometric intervals between the comparison stars were not equal so the accuracy of visual estimates decreased with increasing brightness of V839 Oph. The supposed mean error of a single estimate near minimum light is ± 0.03 mag and ± 0.02 mag, while near maximum light it is ± 0.05 mag and ± 0.04 mag for the years 1994 and 1995, respectively.
All estimates made during one year were processed together and not separately for each night as it is usually done. This enabled to obtain two large, internally homogenous sets of data which were suitable not only for the determination of times of minimum light but also for studying changes of the light curve. Altogether 75 times of minima were derived (36 in 1994 and 39 in 1995) using the classic tracing paper method and its computer version provided by the B.R.N.O. - Variable Star Section of the Czech Astronomical Society. Moment of each minimum was determined repeatedly five times. The author's visual minima timings given to four decimal places in Table 1 represent average values of these determinations.
The observed brightness of V839 Oph is expressed below in subjective "estimate degrees" because precise photoelectric measurements of the comparison stars enabling the conversion of estimate degrees to magnitudes are not available to the author. The light curves from individual nights presented in this paper are as they were observed, no point was excluded, no smoothing was done.
3. Changes of orbital period
Preliminary period of light changes together with the first formula for predicting the times of minima of V839 Oph was published by Rigollet (1947):
| Min. = JD(hel) 24 31 587.7617 + 0.204526 x E |
He recognized that if the variable was an eclipsing binary of the W UMa type its orbital period had to be two times longer than the apparent period of light changes (see the value in parentheses).
Binnendijk (1960) derived from his photoelectric observations the following light elements:
| Min.I = JD(hel) 24 36 361.7317 + 0.4089946 x E |
These elements were taken into the third edition of GCVS (1969). Wilson and O'Toole (1965) calculated from two times of secondary minima (one determined by them and one by Binnendijk) the value of orbital period P = 0.4089958 day which was slightly different from the period given by Binnendijk. Refined elements then appeared in SAC 54 (1983):
| Min.I = JD(hel) 24 36 361.729 + 0.4089955 x E |
and in the fourth edition of GCVS (1985-1987):
| Min.I = JD(hel) 24 40 448.4129 + 0.40899532 x E |
Isles (1989) published corrected elements based on visual observations made by three members of the BAA VSS:
| Min.I = JD(hel) 24 45 925.277 + 0.409015 x E |
The most recent elements are given in SAC 64 (1993):
| Min.I = JD(hel) 24 47 062.3226 + 0.4090026 x E |
Till now no detailed study of orbital period changes of V839 Oph has been published. Previous authors of papers on this star stated that they had not enough data for such study. P. Hajek (1991) using 81 times of minima was the first who concluded that the O-C diagram of this eclipsing binary has a parabolic shape and that its orbital period is systematically increasing. Light elements with a quadratic term that expresses the long-term increase in the orbital period were published recently by Wolf et al. (1996):
| Min.I = JD(hel) 24 40 448.4019 + 0.40899634 x E + 1.73 x 10^-10 x E^2 |
and by Akalin and Derman (1997):
| Min.I = JD(hel) 24 49 536.38555 + 0.4090041886 x E + 1.7524 x 10^-10 x E^2 |
By the end of 1997 altogether 284 minimum timings were available, of which 98 were based on classic photoelectric, 4 on photographic, 6 on CCD camera, and 176 on visual observations. They are presented in Table 1.
Table 1: List of minima timings of V839 Oph
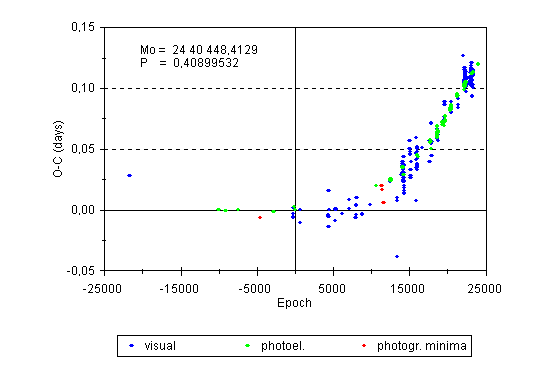
Epochs and O-C residuals from Table 1 are plotted in Figure 1.

Figure 1: O-C diagram of V839 Oph.
First view of Figure 1 reveals the long-term trend toward period increase and seems to confirm the parabolic course of O-C residuals reported by Hajek (1991). However, detailed view of the diagram discloses that the course of O-C residuals is not exactly parabolic but that the curve is probably composed of several linear segments. (If the graph had true parabolic shape, then e.g. the O-C value of the first visual minimum from the year 1945 should be the same as that of a minimum from the year 1994, i.e. three times higher than it actually is.) It suggests that the increase in O-C residuals is not continual and that since the year 1945 the variable at least three times abruptly changed its orbital period.
The first documented change of orbital period occurred sometime within the interval of years 1945-1958 (epochs -21 664.5 to -9992) when it increased at least by 0.2 second. Then the period remained constant for at least 20 years and corresponded to the elements (4). The second change occurred in the year 1978 (increase by 0.4-0.5 second near epoch 7830), and the third in the year 1989 (increase by 0.5 second near epoch 17 480). For the time intervals between the period changes linear elements were computed with the use of the least squares method. Because of low accuracy of most of the visual observations only 98 classic photoelectric, 5 CCD and 3 average values (obtained by grouping 17 times of visual minima within the interval not covered by photoelectric data) were employed in these computations. The results are as follows:
Time interval / Elements
1945-1958 (JD 24 31 558 - 24 36 362)
| P < 0.40899296 |
1958-1978 (JD 24 36 362 - 24 43 650)
| Min.I = JD(hel) 24 40 448.41365 + 0.408995445 x E (without visual minima) |
| Min.I = JD(hel) 24 40 448.40756 + 0.408994714 x E (with visual minima) |
1978-1989 (JD 24 43 650 - 24 47 598)
| Min.I = JD(hel) 24 44 815.27212 + 0.409000463 x E |
1989-1996 (JD 24 47 598 - 24 50 284)
| Min.I = JD(hel) 24 47 703.22588 + 0.409006142 x E |
Only one time of minimum was obtained before the year 1958, so it was not possible to calculate elements for this interval. Therefore only the value of orbital period is presented assuming that only one period change occurred at that time. All these results are illustrated by Figure 2.
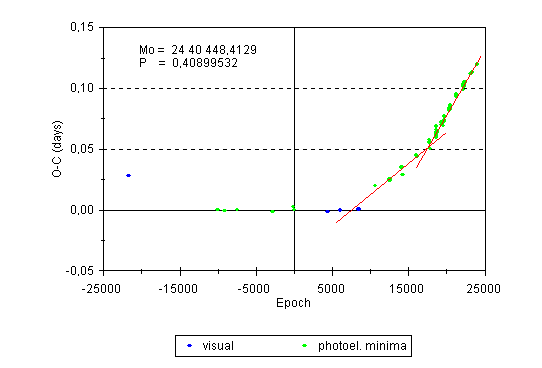
Figure 2: O-C diagram of V839 Oph cleared of inaccurate visual and photographic minima timings (except the first minimum from the year 1945). The green and blue points indicate photoelectric and averaged visual times of minima, respectively. The straight lines represent linear fits to data from given intervals and correspond to the elements (11) and (12).
Elements for the interval 1958-1978 relatively well agree with the elements (2), (3), and (4) published earlier by other authors. However, elements (5) are not in agreement with the times of photoelectric minima from the interval 1978-1989. Elements (6) contain the period value that is close to an average value of the periods for two intervals, 1978-1989 and 1989-1996.
Until the year 1994 it was possible to study only long-term variations of the orbital period of V839 Oph. The large amount of visual observations done in 1994 and 1995 enabled to investigate also short-term period changes. On the basis of 35 times of minimum light from the year 1994 (first, most disparate minimum excluded) and 39 times of minima from 1995 obtained by the author of this paper instant elements were derived for each observing season using the least squares method:
Time interval / Elements
1994 (JD 24 49 536 - 24 49 639)
| Min.I = JD(hel) 24 49 486.50325 + 0.408972637 x E |
1995 (JD 24 49 783 - 24 50 013)
| Min.I = JD(hel) 24 49 783.42981 + 0.409006452 x E |
Surprisingly, in 1994 the period was by 2.9 second shorter than the mean value for the interval 1989-1996. Moreover, the height of the first O-C values from the year 1994 can be explained only if we accept that during about 700 preceeding epochs the period had increased by at least 1.5 second in comparison with the elements for 1989-1996. So the real decrease of the period in 1994 amounted to more than 4.4 seconds or 1.2 x 10^-4 P. The observations suggest that in 1995 the period had increased again by 2.9 second and had returned to the value valid for the interval 1989-1996. These findings are illustrated by Figure 3.
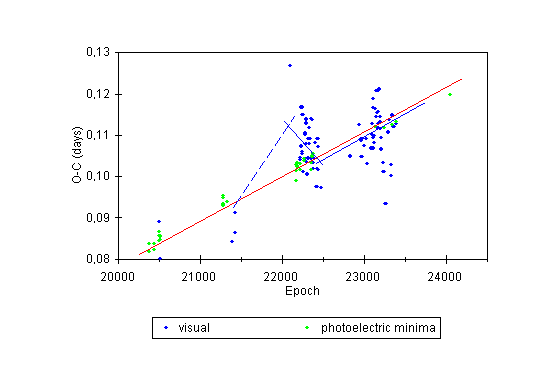
Figure 3: O-C diagram of V839 Oph for the years 1992-1996. The stright lines except the broken line represent linear fits to data from given intervals and correspond to the elements (12), (13), and (14).
Figures 4 and 5 provide more detailed view of the course of O-C values in individual observing seasons 1994 and 1995. Here the straight lines represent the same linear fits as in Figure 3. These fits do not include photoelectric minima and the visual minima Nos 201, 274, 277, 278.
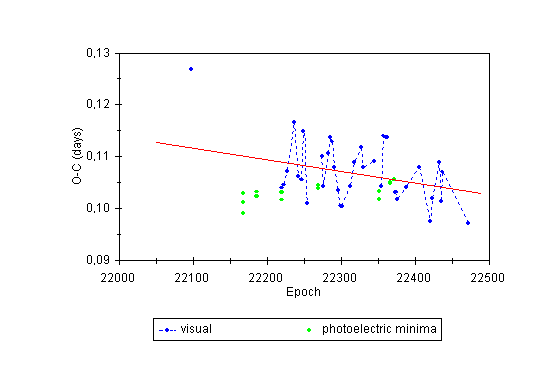
Figure 4: O-C diagram of V839 Oph for the year 1994.
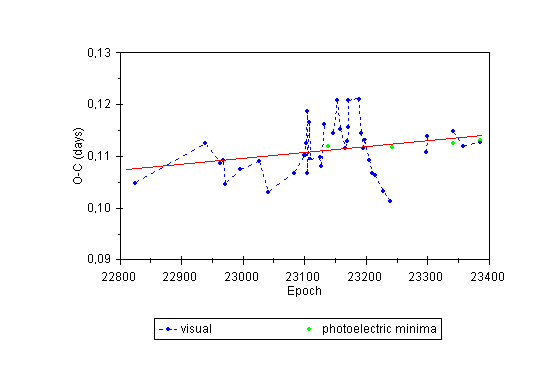
Figure 5: O-C diagram of V839 Oph for the year 1995.
The comparison of Figures 4 and 5 clearly documents that the orbital period of V839 Oph was different in 1994 and 1995. But these figures show another interesting feature: a large scatter of O-C values exceeding 3-5 times the mean error of visual determination of time of minimum light which is supposed to be ± 2-3 minutes. The scatter had different character in both observing seasons. In 1994 (with exception of the first value) the scatter had approximatelly constant amplitude of ± 10 minutes during the whole season. In 1995 the scatter was gradually increasing from about ± 5 minutes to ± 15 minutes and then within one day it completely disappeared.
During the interval of 21 days (JD 24 49 932 - 24 49 953) or 51 epochs (epochs 23 188 - 23 239) the O-C values decreased by half an hour. Just on the next night (JD 24 49 954) the O-C residual returned to its mean value of that time and during the following two months the O-C residuals remained without any variation. The comparison of photoelectric and visual times of minima from this two months interval gives some feeling of the accuracy of visual observations. The reality of the scatter of O-C values in 1994 and 1995 is supported by the fact that rapid changes in O-C residuals were not chaotic but they appeared as quasi-periodic oscillations. The mean period of these oscillations was about 5 days (12 epochs) in 1994 and about 12 days (27 epochs) in 1995.
We can conclude that visual observations done in the years 1994 and 1995 revealed so far unknown fact that in V839 Oph besides the long-term increase in the period also short-term (seasonal) period variations occur. The observations revealed also rapid quasi-periodic displacements of times of minimum light that were not directly in connection with the changes of orbital period.
The long-term trend toward period increase can be explained either by mass transfer from the secondary, less massive component to the more massive primary component of the binary or by mass outflow from the secondary component into the outer (circumbinary) envelope, or by combination of both these processes. At any case, the difference between masses of the primary and the secondary component is increasing. The cause of short-term period changes is unknown and for its clarification much more observational data is needed.
4. Changes of the light curve
The comparison of all published photoelectric measurements obtained in the years 1958, 1959, 1961, 1983 and 1988 (Binnendijk, 1960; Wilson and O'Toole, 1964; Lafta and Grainger, 1985; Niarchos, 1989) suggests that the light curve of V839 Oph had constant shape during this 30-year interval. It showed only small changes characteristic of W UMa-stars, e. g. rapid variation of the depth of minima and the height of maxima with the amplitude of several hunderths of magnitude, slight asymmetries near minima and maxima, etc.
However, observations done at the Petrin Hill Observatory in the years 1994 and 1995 provided quite different picture: The light curve variability was so large that it was clearly discernible even by visual observations. In contrast to usual light curves of W UMa-stars there were distinguishable beginnings and ends of eclipses. The duration of eclipses (D) varied between 1 and 2.3 hours. Changes of D were very rapid as can be seen in Figure 6.
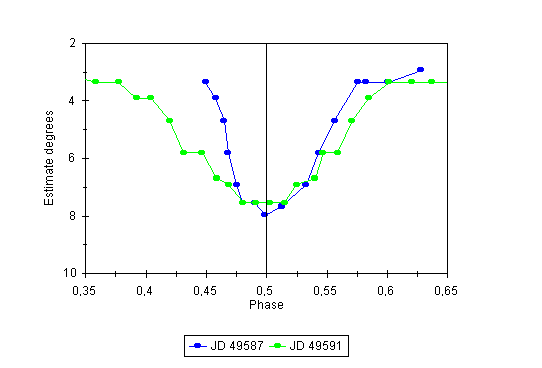
Figure 6: An example of rapid change in the duration of eclipses. In JD 24 49 587 the secondary eclipse lasted only about 75 minutes, in JD 24 49 591 (four days later) it lasted about 135 minutes. The level of brightness just before and after eclipse as well as the depth of minima seem to be approximately the same on both these nights.
Some minima were sharp (without interval of constant light) some other had intervals of constant light (d) lasting up to three quarters of an hour (see Figure 7).
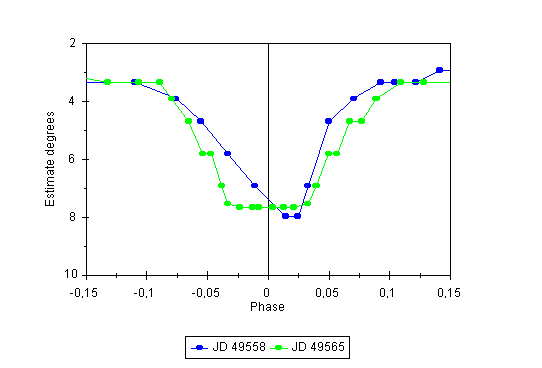
Figure 7: An example of rapid changes in the light curve symmetry and the duration of constant light in minimum. In JD 24 49 558 the light curve in primary minimum was sharp and strongly asymmetric while in JD 24 49 565 (seven days later) it had flat bottom lasting about 40 minutes and its shape was symmetric.
Beginnings and ends of eclipses exhibited shifts within the interval of half an hour when compared to the moment of theoretical mid-eclipse which caused the above mentioned scatter of times of minimum light with the same amplitude (i.e. up to half an hour). The interval when these shifts were most conspicuous was between JD 24 49 932 and JD 24 49 953 (epochs 23 188 - 23 239). Within this interval there were observed nine minima (three primary and six secondary). The light curves of four of the six secondary minima are shown in Figure 8.

Figure 8: A superposition of four light curves of secondary minima from the interval between JD 24 49 932 - 24 49 953 showing gradual shift of the whole curves by half an hour or 0.05 P toward earlier phases.
It is apparent that not changes of the shape (which was, except some irregularities at bottom, almost constant at that time) but a shift of the whole curves caused the displacement of times of minimum light (cf. Figure 5). There were, indeed, also large changes in symmetry of the light curves during eclipses. Some light curves were quite symmetric, some other were strongly asymmetric with the descent to minimum light two times slower than the ascent or inversely (see Figure 7). The depth of minima and the hight of maxima varied within the interval of 0.1 - 0.2 mag. The displacement of maxima in relation to theoretical moments of maximum light reached up to ± 1 hour (see Figure 9). In this and the following figures thin vertical lines between descending and ascending branches mark the theoretical mid-eclipse computed with the use of instant elements valid for given observing season.
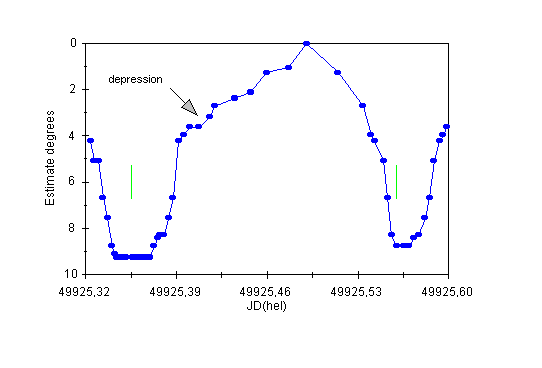
Figure 9: The light curve of V839 Oph on the night of July 26/27th, 1995. First minimum (primary) has a flat bottom lasting about half an hour while the second is much narrower and wihout flat bottom. Both minima and the maximum are shifted toward later phases: Min. I by 6 minutes, Min. II by 13 minutes, and Max. I by about 40 minutes.
There were deformations of the light curve in phases preceding the beginning of eclipse and following the end of eclipse appearing as depressions of various size (see Figures 9, 10, and 11).
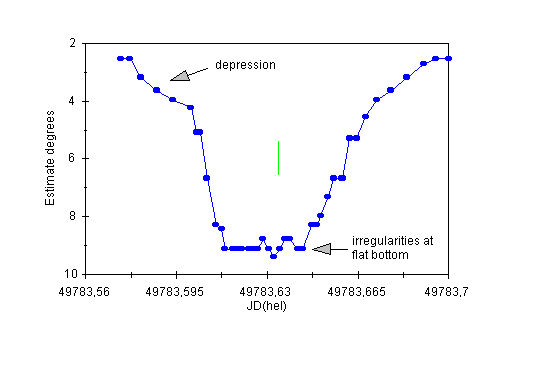
Figure 10: The light curve of V839 Oph (secondary minimum) on the night of March 6/7th, 1995.
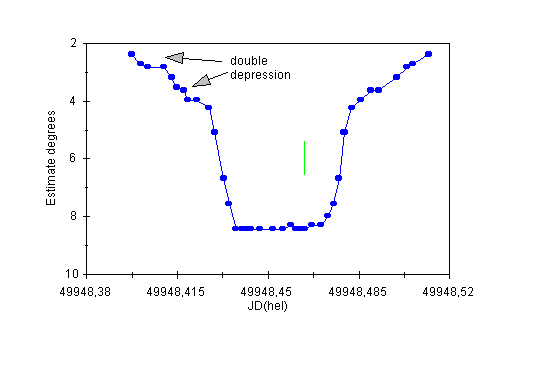
Figure 11: The light curve of V839 Oph (secondary minimum) on the night of August 18/19th, 1995.
Other kinds of irreguralities of the light curve are illustrated by Figures 10, 12, 13, and 14.
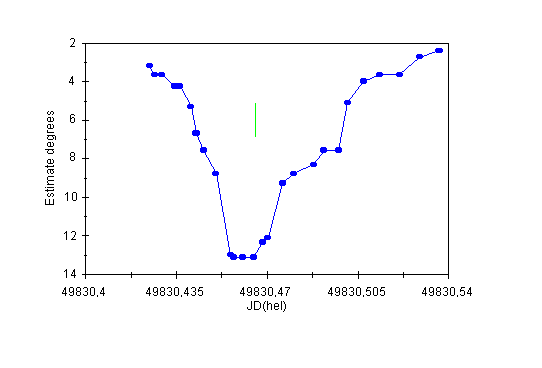
Figure 12: The light curve of V839 Oph (primary minimum) on the night of April 22/23rd, 1995. The minimum is extremely deep.
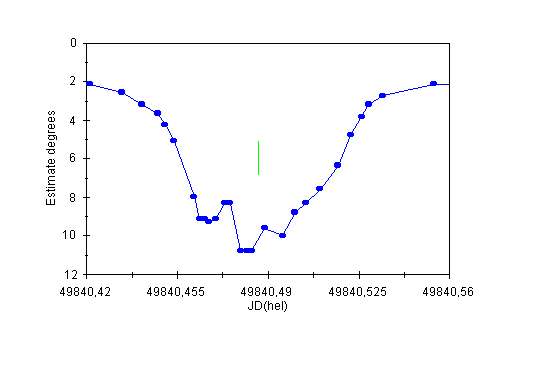
Figure 13: The light curve of V839 Oph (secondary minimum) on the night of May 2/3rd, 1995.
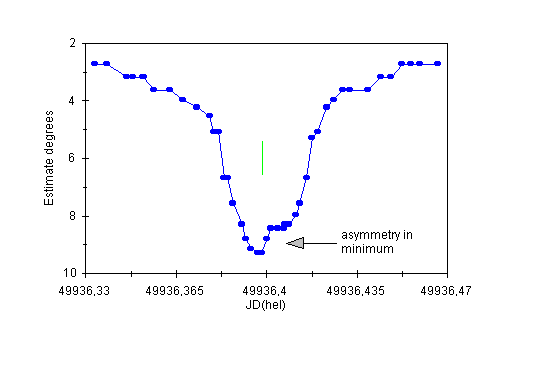
Figure 14: The light curve of V839 Oph (primary minimum) on the night of August 6/7th, 1995.
All these changes in the light curve were very rapid, usually they occurred within a few days, sometimes a remarkable change occurred even from night to night. As to the changes, no difference between primary and secondary minima could be found. Special mention deserves the discovery of very short decreases of brightness by up to 0.2 mag lasting less than 10 minutes. At first view they look like observational errors but their reality is supported by the fact that they are bound to certain orbital phases. Table 2 lists six such events that are with high probability real.
Table 2: Very short-lasting decreases of brighthess ("anti-flares") in V839 Oph
| No. | Phase | Approx. value of the decrease | |
| 24 49 548.443 | |||
| 24 49 843.544 | |||
| 24 49 853.565 | |||
| 24 49 872.378 | |||
| 24 49 872.386 | |||
| 24 49 899.568 | 0.952 |
Note that "anti-flares" No.1 and No. 6 as well as No. 2 and No. 3 differ exactly by half-period. Two examples of these very short-lasting decreases of brightness are presented in Figures 15 and 16.
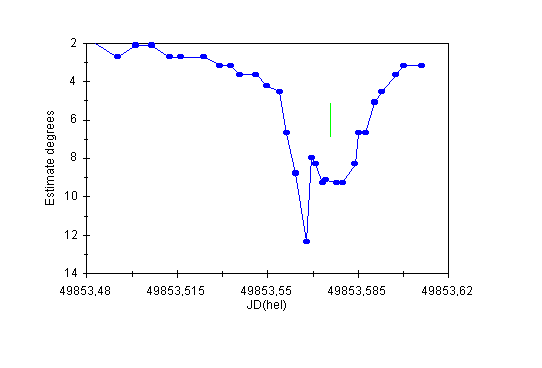
Figure 15: The light curve of V839 Oph (secondary minimum) on the night of May 15/16th, 1995 showing an anti-flare.
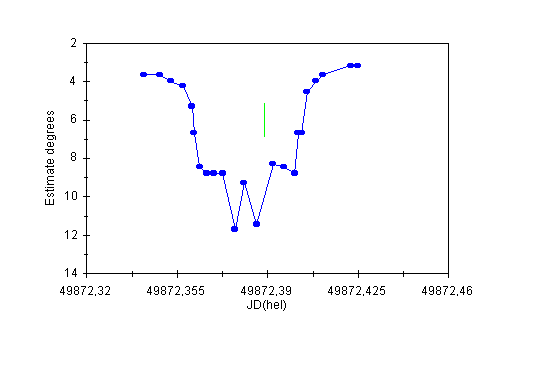
Figure 16: The light curve of V839 Oph (secondary minimum) on the night of June 3/4th, 1995 showing two anti-flares.
In Figure 17 series of photoelectric measurements from the years 1958 a 1959 and visual observations (about 1250 estimates) from the year 1995 are superposed on one epoch. The superposition is only approximate because estimate degrees can not be correctly transformed to magnitudes. Yet the figure shows that during eclipses almost all visual estimates lie inside the photoelectric curve which means that all the above described changes of the light curve from the year 1995 (as well as from the year 1994) took place within the limits given by the photoelectric light curve.
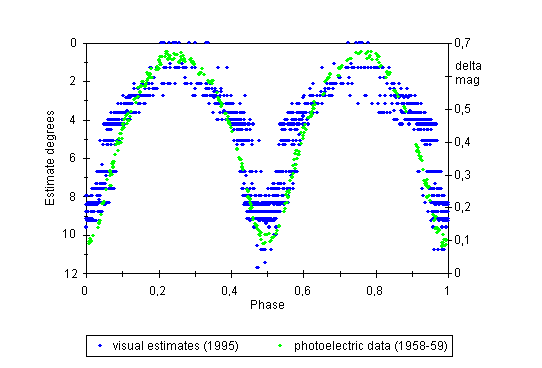
Figure 17: Comparison of photoelectric light curve of V839 Oph from the years 1958-1959 and visual estimates from the year 1995.
Mean light curves based on visual observations from the years 1994 and 1995 are presented in Figure 18.
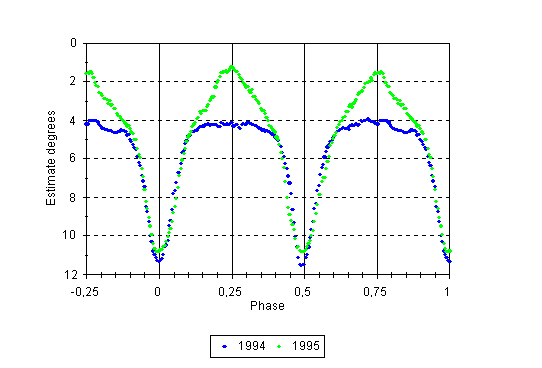
Figure 18: The mean light curves of V839 Oph for the years 1994 and 1995.
This figure shows that both minima as well as both maxima were fainter in 1994 when compared to 1995. In 1994, mean secondary minimum was by 0.01 - 0.02 mag deeper than mean primary minimum, both maxima were unusually flat, and there was conspicuous depression just before the beginning of primary eclipse (phases 0.8 - 0.9). In 1995, both minima had equal depth, both maxima had normal shape (cf. photoelectric light curve in Figure 17), and the depression between phases 0.8 - 0.9 was missing. The reality of flat maxima in 1994 can be questioned because the phases around maximum light are poorly covered by observations and the bins within which moving averages of individual estimates were calculated had to be broadened in these areas.
However, light curves obtained at the beginning of the next observing season (1995), when the star was observed more frequently also in maximum light, exhibit some transition features of the two mean light curves: In the spring of 1995 the first maximum (phase 0.25) was almost normal but the second maximum (phase 0.75) remained flat. Because the beginning of observing season 1995 was anomalous also for other reasons (e.g. extremely deep primary minima, increased incidence of "anti-flares"), a mean light curve especially for this interval (March 7th - June 28th, 1995; 349 estimates of brightness) have been calculated. It is presented in Figure 19.
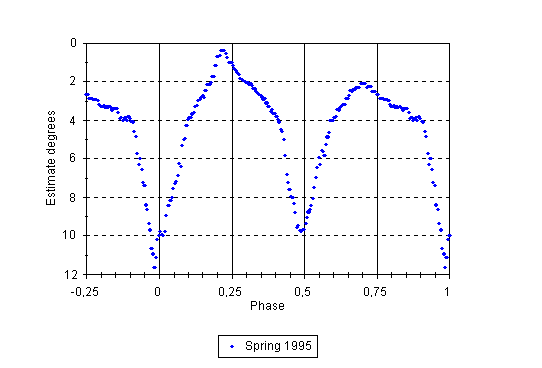
Figure 19: The mean light curve of V839 Oph for the interval March 7th - June 28th, 1995.
In this figure all extremes of the light curve are shifted toward earlier phases. The phase of Min. I is approximately -0.020 (= 0.980), Min. II 0.485, Max. I 0.225, and Max. II 0.710. Min. I is by 1 estimate degree (about 0.06 mag) deeper and Min. II by 1 estimate degree higher than in the mean light curve for the whole observing season 1995. On the other hand, Max. I is by 1 estimate degree higher and Max. II by 1 estimate degree deeper than in the mean light curve for the year 1995. Due to all these features, the light curve in Figure 19 is extremely asymmetric. Between the phases 0.8 - 0.9 remnants of depression from the year 1994 can be distinguished.
This figure illustrates another interesting phenomenon: the reverse course of asymmetry in some primary and secondary minima or maxima. The light curve around Max. II (phases 0.6 - 0.9) in this figure is almost exact mirror image of the light curve around Max. I (JD 24 49 925.39 - 24 49 925.54) presented in Figure 9. Similarly, the strongly asymmetric primary minimum in JD 24 49 558 (shown in Figure 7) was just on the next night followed by asymmetric secondary minimum (not depicted here) with exactly reverse course of light curve.
As to the explanation of the above mentioned changes of the light curve, we can take into consideration five possibilities:
1. Changes of inclination of the orbital plane. If there is a third body near a binary star it can change by its gravitational effect the orbital plane of the binary which manifests itself by the change in amplitude of light variations and in the duration of eclipses. However, for changes taking place within a few days this explanation is quite improbable.
2. Pulsations of one or of both stars. There are eclipsing binaries one component of which is pulsating. In the case of V839 Oph the star would had started to pulsate in the year 1994 and it must pulsate inward (see Figure 17). But deformations of the light curve lasting only a few minutes as well as long stand-stills in minimum light cannot be explained by pulsations.
3. Spots on the surface of component stars. By the presence of dark spots of various size and duration the observed irregularities of light curves of W UMa-stars are explained most frequently. The presence of spots causes deformations of light curves but it can not influence the whole duration of eclipses because dimensions of stars remain unchanged.
4. A shell of circumstellar material orbiting around the binary system. In contact binaries of the W UMa type it is supposed the existence of an envelope surrounding both stars in which accumulates the matter that has overflowed Roche lobes of both components. Unequal thickness or density of rotating envelope can cause changes in brightness of given binary star during eclipses as well as outside eclipses. But similarly like in the previous case it cannot explain changes in the duration of eclipses, appearing and disappearing of stand-stills in minimum light, etc.
5. A body obrbiting around one component of the binary. In many interacting binaries, matter flowing out of one component through the inner Lagrangian point do not fall directly on the surface of the second component but it accumulates around it in the form of an accretion disk. Changes in dimensions and irregularities of this rotating ring-like object can cause slow or rapid variations in brightness that influence the shape of the light curve of given eclipsing binary. However, in case of the W UMa-stars it is generally supposed that their components are so close togehter that there is no space allowing a body to orbit only around one of them.
Although the theoretically feasible explanations of the above described changes of the light curve of V839 Oph are only briefly outlined here, it is apparent that a serious objection can be raised against each of them. Despite the objections at least one of these explanations have to be correct. Which of them is it? The answer will be tried to find in the following part of this paper.
| Go to Part 2 of this article |
| Go top |